Aug 25, 2013

Completed 31 orbits around the Sun!


Today I completed my 31st journey around the Sun, from Earth. To celebrate the occasion, Jaisri carefully plucked 31 'Sun' flowers, tied them together and made a hand-made bouquet. Thank you so much Jaisri!

Aug 16, 2013

Top 10 Productivity Tools in Matlab

Rick Rosson is a Senior Applications Engineer at Mathworks, a company that developed the Matrix Laborary (Matlab) software. He gave a talk on top ten productivity tools in Matlab, most of which I already knew. Still, I liked the talk because I got a free Matlab logo sticker for answering correctly to a question he posed during the talk (Yay!).

Here is the list of top ten productivity tools in Matlab according to Rick Rosson (not in any particular order though).
  1. Code Analyser
  2. Section Mode
  3. Publishing
  4. Command History
  5. doc command
  6. Tab completion
  7. Inline syntax guidance
  8. Automatic variable name change
  9. Matlab path
  10. startup.m
You can read about all the above ten tools from Mathworks website, however, let me give you a brief introduction to each of the tools.
 
Code Analyser: This is a new feature in Matlab which you will find at the top right corner of Matlab editor window. If your script is error free, the code analyser indicator will turn green indicating everything is alright. If your code is inefficient, or has error which does not affect the execution of the code, it turns yellow. As you would have probably guessed by now, the code analyser indicator turns red if there is any error in your script that affects the execution of the code.

Section Mode: As a Matlab user, you would have probably known that '%' symbol at the beginning of a line is used to comment a sentence. Instead, if you use '%%' symbol, it will still work as comment, but in addition, it starts a new section. So if you are writing a code which can be split into several sections (or modules), you can separate them by using '%%'. For example, you can have a section to read or import the data, another section to analyse the data and one more for making plots.

Publishing: One useful feature about Matlab is its ability to publish a report in the form of pdf or html or in many other formats. Traditionally, I execute each plot, save them as jpg or eps format and manually add/import results to create a presentation file or a report in word format. All these can be done now at the click of a button. What more? The comment tag that you type followed by the '%%' symbol will become section header when you publish!

Command History: Had a bingo moment when you created that plot some time ago, but struggling to find how did you create it later on? Command History comes to your rescue in such situations. As the name suggests, the command history windows remembers all the commands you had every typed since the last time you cleared the history manually. You can even select a portion of history and make a script out of it.

doc command: While help command gives you a rough idea of what the function is about, doc command will give you more details and insight of the function. In other words, doc gives you a complete documentation about a function which you want to learn how to use.

Tab completion: This, I think, probably came from working in a Linux environment. Its probably useful when you are creating a Matlab script that runs to 1000s of lines. To speed up writing a code, type first few characters of a command (typically two to three characters) and then hit Tab command to autofill, or to choose the right command from a list of options.

Inline syntax guidance: You probably have an idea of name of a function that you want to use, but not sure about its syntax? Don't worry. Just type the function name and wait for fraction of a second. The inline syntax guidance will pop up with a help window showing various syntax options by which the function can be called.

Automatic variable change: Suppose if you have written a function for a specific problem. And now, you want to generalize it by changing specific variable name such as 'temp' to more general variable name, such as 'x'. You have probably done this using find and replace tool. But the catch is that there could be several variables starting with temp, for eg, tempoutside, temproom. Find and Replace would probably do a nasty work (if you do try, you will get xoutside, xroom instead of general variable names such as x1, x2 etc). Automatic variable change does this job more efficiently. Just change the variable name 'temp' to 'x', hold the Shift Key and hit Enter button. It will search and replace only the variable name 'temp'.

Matlab path: addpath command adds the path to custom library folder where users can create and save custom library files specific to their work. By default, Matlab would search for a function in the current directory. In case the current directory does not have the function file, addpath will tell Matlab where to search for it.

startup.m: Instead of using addpath command every time you open a new session in Matlab, you can write a startup script and set all the paths. Matlab would execute the startup script every time it is started, and automatically add paths to various custom libraries and functions.

In addition to the top ten productivity tools, Rick also listed ten more productivity tools. They are
  1. tic toc
  2. profiler
  3. file compare
  4. todo fixme
  5. debugger
  6. stack browser
  7. plot browser
  8. plot tools
  9. generate script
  10. file import wizard.
Thanks to audience's frequent interruptions and their effort to make this talk "An introduction to Matlab", Rick did not have time to discuss about these ten tools. But then, we have Google right?

Aug 7, 2013

Astrology: A rational introduction

Astrology can be defined as “Logical interpretation of movements and relative positions of certain astronomical bodies with a belief that they have an influence on human affairs.”

When it comes to Astrology, entire population on earth fall into two groups; the first group is the ones who do not believe in astrology, while the second group is those who believe in astrology with a question, “People have been believing it for several millennia. How can they all be wrong?”.

True. There are evidence pointing out that kings had referred to astrology to predict the outcome of a war or natural calamities such as flood and drought. Astro bodies at certain positions were considered as a positive omen to start a public project such as building bridges, dams or temples and sometimes, even for the journey of a pilgrimage.

Does the position of certain astronomical bodies such as sun, moon, and planets really have an effect in predicting human behavior? Maybe, maybe not. But that is not what I'm going to write about in this blog post. Rather, I am going to focus on understanding the rationale behind astrology, scientific arguments which have made many generations believe in this field.

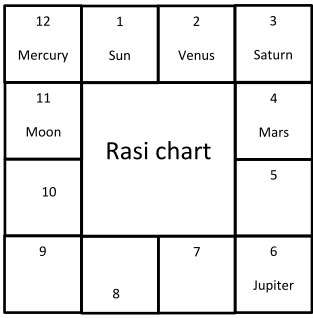
Let me first introduce you to the framework of a horoscope. The following picture shows a typical Tamil horoscope (also known as Jathagam). The building blocks of such a horoscope are the twelve boxes, popularly known as houses.

Typical horoscope showing the position of major planets

Before explaining the significance of twelve, let us first look into one of the most profound mathematical concept; 360 degrees. Many things that happen around us can be explained using 360 degrees. For example, earth completes 360 degrees when it revolves around itself once. It completes 360 degrees when it completes one full rotation (orbit) around the sun. Similar to Earth, other planets also complete 360 degrees for one full revolution about itself or one full orbit around the sun. Moon completes 360 degrees to orbit around the earth.

How can we perceive this 360 degrees movement of various astronomical bodies based on observations from a naked eye? There are several ways to do it. One simple way is to divide 360 degrees into 360 1-degree sectors and keep track of the planets when the move from one sector to another. However, certain planets such as Jupiter are farther away from the sun that it is extremely difficult to keep track of their 1-degree movement using naked eye.

We need to divide 360 into larger sectors to make the objects traceable. How large? Let us say, 4 sectors of 90 degrees each? The problem with such a fewer number of segments is that it becomes impossible to track the faster movement of planets that are closer to the sun, such as Mercury. So just like one would conduct a grid independence study, based on the experience people have found that having 12 sectors of 30 degrees each will make this problem tractable. But, on what rational basis did they arrive at twelve?

A long time ago, when there were no telescopes and technological gadgets around, people relied on naked eye observations. With no city lights to pollute, clear sky nights were absolutely dark that they were able to see far more stellar objects that are possible to see today only with the help of powerful telescopes.

One disadvantage of such a dark and starry sky is that it is extremely difficult to keep track of the movement of one particular object over a period of time. Solution? They started looking at the star's background to find its relative position with respect to other stars in its vicinity. In order to remember the position of various stars in the surrounding of the planet under observation, they identified some of the bright stars which do not move (on a relative scale) with respect to the planet. To make the problem easier, they grouped some of those bright stars to form a shape that is easy to remember. In other words, they formed a constellation.

They identified twelve major constellations with the help of twenty seven brightest and easily recognizable stars. The twelve constellations were roughly 30 degrees apart. So the problem of tracing a planet is now reduced to identifying in what background (constellation) does the planet lies at a specified time.

We would love to give names to anything right? Of course, we give names not only to the newborn but also to pets and things around. So it's not a wonder that people named those constellations (houses) based on their patterns such as Aries (Mesha), Taurus (Vrishabha) etc.

Now, all that one needs to do is to find in which house (constellation) does each of the observable planets reside at the time of their birth. In the typical example shown in the picture above, one can see that when viewed from the Earth (that's the reason why you won't find Earth in any of the houses), Mercury would set before sun while Venus sets right after sunset, followed by the Moon. When the sun and moon are in the same house, it is no moon day (or Amavasya) and when the sun and the moon are 180 degrees apart (or 6 houses apart), it is full moon day (or Purnima).

In terms of time, Earth takes 24 hours to complete one full revolution around itself (360 degrees). In other words, it takes 2 hours to rotate by 30 degrees. Since sunrise and sunset is defined with respect to Earth's rotation, the setting time of Mercury (Venus) would not be more than 2 hours before (after) sunset. However, using the same chart, it is possible to fix our frame of reference for time on some other planet as well.

For example, Jupiter takes 11.86 Earth years (4332 Earth days) to complete one orbit around the Sun (360 degrees). Hence, in order that Jupiter moves its position from one house to another (Transit of Jupiter), it will take 361 days (~ 1 Earth year).

Now the main question still remains. Does the location of planets in an arbitrary background at the time of one's birth have any significance in predicting their future? I will leave it up to the readers to find an answer to this question!

Aug 4, 2013

Novice Academician


While having a conversation with my wife, she asked me question, "Who inspired you to blog?"

The question sets my train of thoughts in motion. I looked back in to my glorious but forgotten past. It was in 2007 when I first ventured into blogging.

Back then, I was working as a SRF and have been following a few blogs that were published by professors on science and engineering topics. At some point, I believe, reading their articles inspired me to write!

I started a blog and named it after condensed form of my name, sramanujam. It was a wordpress blog. Soon, I changed the name of my blog to Novice Academician, though the domain name remain unchanged.

But I wasn't really an academician then! So I had set my blog's tagline as "not yet; will soon be".

Novice Academician published articles mostly on math, news, heat transfer and other sundries. One of my articles I wrote on conduction, convection and radiation got mentioned in a blog carnival.

"Well, I'm not sure who inspired me to blog. But I started blogging way back in 2007", I replied to my wife.

After a desperate search, I found that waybackmachine has archived my first blog that I had deleted about five years ago! Going through some of the articles that I had published in my earlier blog, my wife asked me, "Why did you delete it?"

Honestly, I don't know! Back then, I never thought that deleting a (first) blog is like orphaning it. But now, I feel very bad for what I did. The only thing that consoles me is the fact that there is a website that archives every website published in the world of internet. In fact, of all the websites I had ever browsed, I now rank web.archive.org higher than highest!